Most Common Trademark Classes: What Our Data Reveals

Published on October 28, 2026
Estimated Read Time: 16 minutes

Key Takeaways
- Clothing leads the rankings: Class 25 accounts for 15.41% of all recorded entries.
- Education ranks second: Class 41 represents another 14.39%, making it the highest-volume service class.
- Five classes account for over half the records: Classes 25, 41, 42, 35, and 9 total 48,438 entries.
- Software-related classes have a strong presence: Classes 9 and 42 account for 13,375 entries combined.
- Goods slightly outnumber services: Goods classes represent approximately 52% of the raw dataset, compared with 45.6% for services.
- Popularity does not determine the right class: Your trademark class depends on the goods or services you actually provide.
Quick Answer: According to Trademark Engine's approximately 10 years of historical filing data, Class 25 (Clothing and Footwear) leads with 14,213 recorded entries. It accounts for 29.6% of goods-class entries, while Classes 41, 42, and 35 collectively represent 67.7% of service-class entries.
Which trademark classes attract the most filing activity, and what can those numbers tell us about the businesses seeking brand protection?
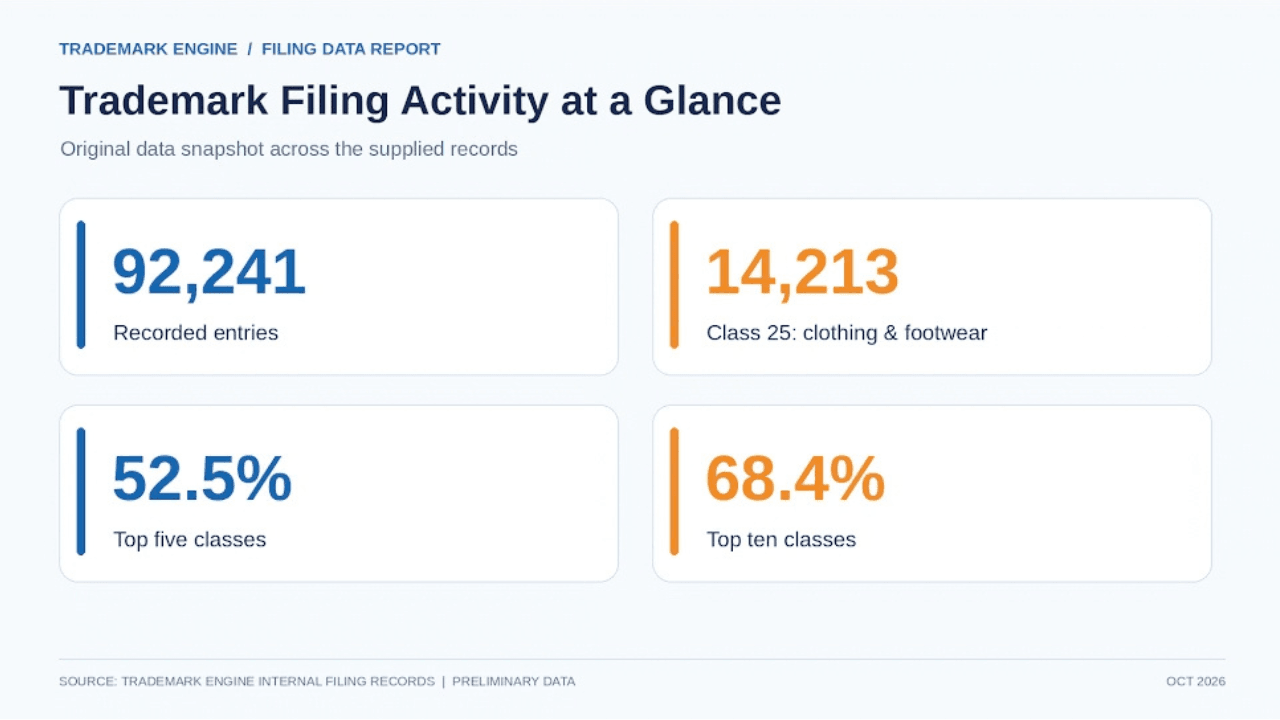
Trademark Engine's internal filing records offer a closer look. Based on approximately 10 years of company history, our analysis of 92,241 recorded entries reveals that clothing and education lead the rankings, followed by technology services, business services, and software products. This all-time dataset provides a historical view of trademark filing activity rather than a snapshot of filings from 2026 alone.
The findings also show how concentrated filing activity is. Just five classes account for more than half of the recorded entries, while several specialized product categories represent comparatively small shares.
For business owners, the data provides more than a popularity ranking. It offers a snapshot of where Trademark Engine customers are filing and helps identify classes worth investigating for different business models.
This report examines the leading categories, compares goods and services, and highlights what these patterns mean when preparing your own trademark application.
Source: Trademark Engine internal filing records supplied for this report. Figures represent recorded database entries, not necessarily unique applications or completed registrations.
A Snapshot of Trademark Engine's Filing Activity
Trademark Engine's supplied records span all 45 international trademark classes, covering industries from apparel and online education to financial services, healthcare, manufacturing, and agriculture.
The dataset contains 92,241 entries across 48 source rows. Of these, 90,081 entries have identifiable class numbers, while 2,160 require further classification review.
The distribution reveals a clear pattern: a limited number of classes account for most recorded activity.
The five leading classes contribute 48,438 entries. Expanding the ranking to the top 10 brings the count to 63,124.
In other words, more than two-thirds of the dataset is concentrated in just 10 classes.
That concentration makes the leading categories particularly useful for understanding the profile of Trademark Engine's recorded filing activity.
However, these figures describe the company's supplied records, not the total number of trademark applications filed nationally with the USPTO.
The 10 Most Common Trademark Classes in Trademark Engine's Data
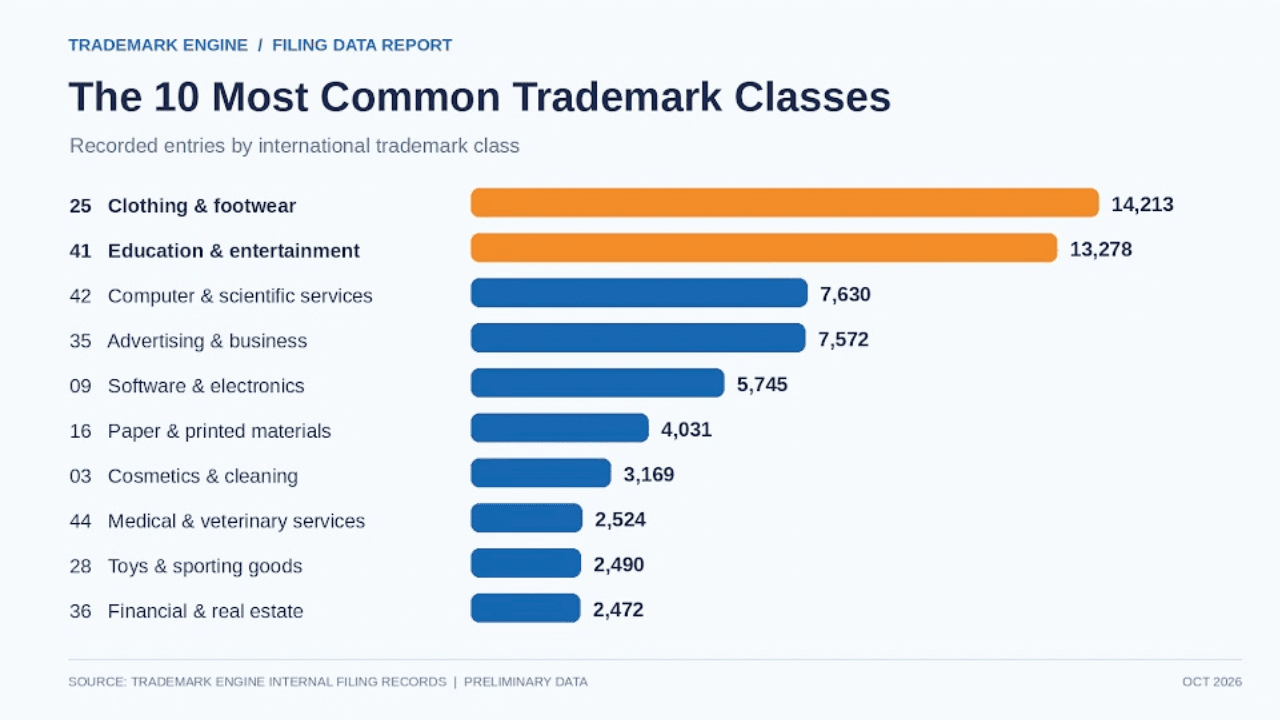
The table below ranks the categories with the highest recorded counts.
| Rank | Trademark Class | Recorded Entries | Share of Total |
|---|---|---|---|
| 1 | Class 25 — Clothing and Footwear | 14,213 | 15.41% |
| 2 | Class 41 — Education and Entertainment | 13,278 | 14.39% |
| 3 | Class 42 — Computer and Scientific Services | 7,630 | 8.27% |
| 4 | Class 35 — Advertising and Business Services | 7,572 | 8.21% |
| 5 | Class 9 — Software and Electronic Products | 5,745 | 6.23% |
| 6 | Class 16 — Paper Goods and Printed Materials | 4,031 | 4.37% |
| 7 | Class 3 — Cosmetics and Cleaning Products | 3,169 | 3.44% |
| 8 | Class 44 — Medical and Veterinary Services | 2,524 | 2.74% |
| 9 | Class 28 — Toys and Sporting Goods | 2,490 | 2.70% |
| 10 | Class 36 — Financial and Real Estate Services | 2,472 | 2.68% |
What Stands Out in the Ranking?
Three findings deserve attention.
First, Class 25 leads Class 41 by just 935 entries. Both stand considerably ahead of the remaining categories.
Second, Class 41 has 5,648 more entries than third-ranked Class 42, making the gap between second and third substantially larger than the gap between first and second.
Third, Classes 42 and 35 are nearly tied. Computer and scientific services lead advertising and business services by only 58 entries.
The numbers show that the top two categories occupy a distinct position, while technology and commercial services form another substantial part of the ranking.
Clothing and Education Account for Nearly 30% of All Entries
Class 25: Clothing and Footwear — 14,213 Entries
Class 25 represents the largest category in Trademark Engine's records.
It generally covers clothing, footwear, and headwear, making it relevant to businesses offering branded apparel, athletic wear, shoes, and similar products.
Class 25 represents 15.41% of the overall dataset, but its share within goods-related filings is even more significant. Of the 47,982 recorded goods-class entries, 14,213 belong to Class 25, meaning clothing and footwear account for 29.6% of all goods-class entries. This makes apparel a particularly prominent category within Trademark Engine's historical goods filing records.
The filing volume is particularly notable when compared with other consumer product classes. Class 25 has more than four times the count of Class 3, which includes cosmetics and cleaning products.
However, not every product sold by an apparel business belongs in Class 25. Handbags may fall under Class 18, while qualifying retail services may require Class 35.
For a closer look at these distinctions, read Trademark Engine's guide to trademarking a clothing brand.
Class 41: Education and Entertainment — 13,278 Entries
Class 41 occupies second place and is the highest-ranked service category.
It covers services such as education, training, entertainment, and certain sporting and cultural activities.
Examples include online courses, workshops, training programs, and entertainment services.
Its 14.39% share places it ahead of technology services, advertising, financial services, and healthcare services.
Together, Classes 25 and 41 account for 27,491 entries, representing approximately 29.8% of the supplied records.
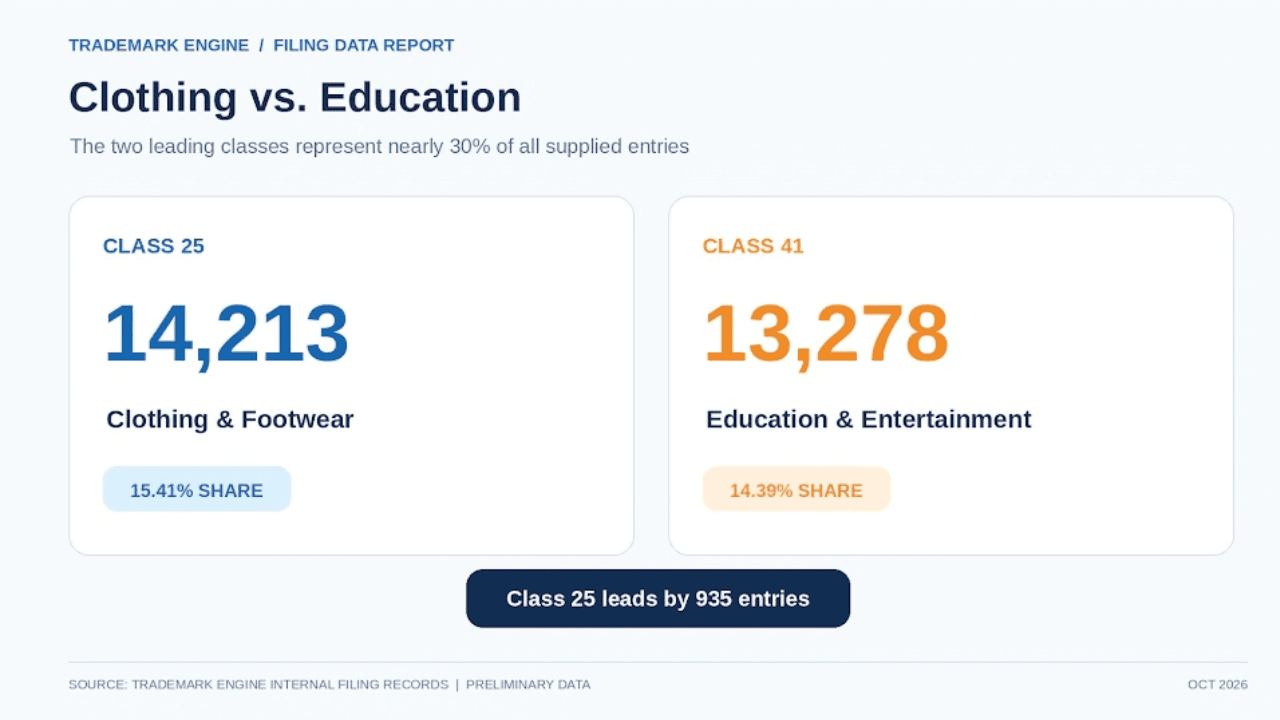
The finding is a useful reminder that substantial trademark filing activity appears in both physical goods and service-based business models.
Technology and Business Services Represent Another Major Filing Group
Three of the top five classes relate to technology, software, or commercial services.
| Class | Category | Recorded Entries |
|---|---|---|
| 42 | Computer and Scientific Services | 7,630 |
| 35 | Advertising and Business Services | 7,572 |
| 9 | Software and Electronic Products | 5,745 |
| Total | 20,947 |
Combined, these classes account for approximately 22.7% of the dataset.
Class 42 includes services such as software development, certain cloud-based software offerings, and scientific research.
Class 35 includes advertising, business management, and qualifying retail services.
Class 9 generally includes downloadable software and certain electronic products.
For technology founders, the distinction between Classes 9 and 42 is especially important. Downloadable software and online non-downloadable software services may require different classifications.
Trademark Engine's guide to trademarking an app name explains how the relevant classes can differ by software delivery model.
Classes 9 and 42 have a combined 13,375 entries, but that does not represent a verified count of unique technology companies. Some applicants may file across multiple classes.
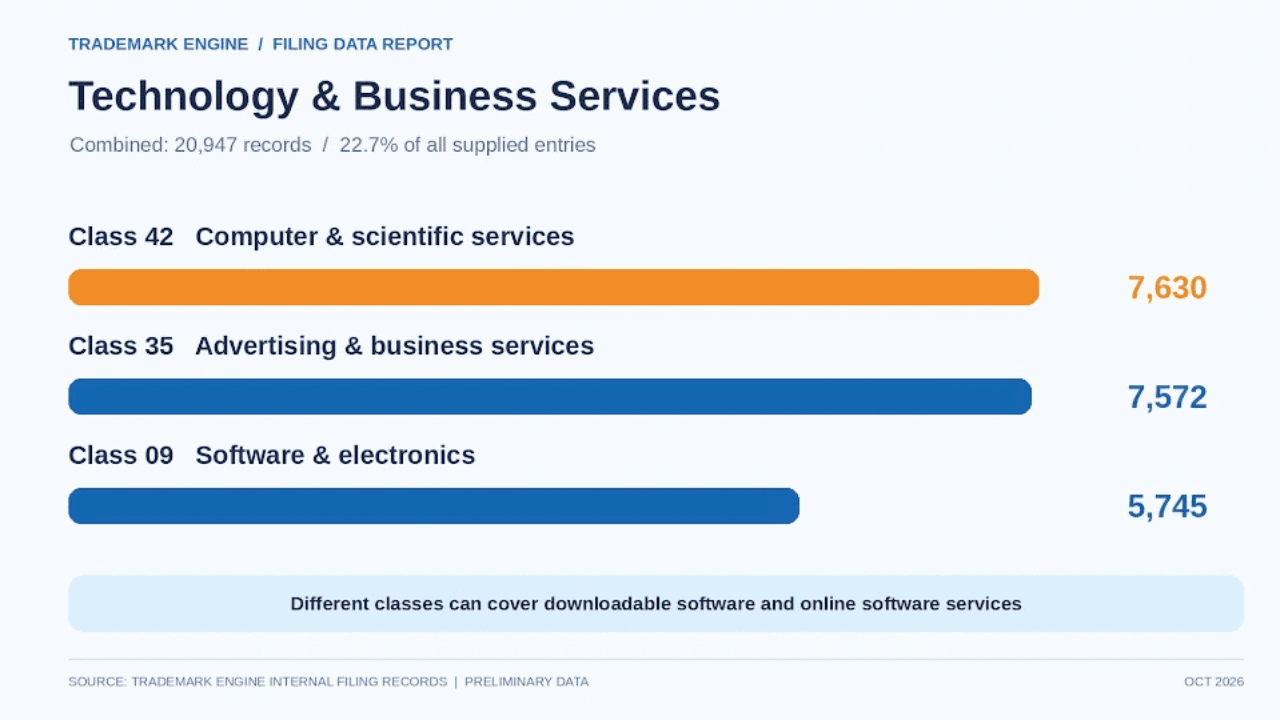
The data establishes that technology and commercial services occupy a substantial place in Trademark Engine's filing records. It does not, by itself, demonstrate an increase in technology filings over time.
How Are Trademark Filings Distributed Across Goods and Services?
The international classification system separates goods into Classes 1–34 and services into Classes 35–45.
Grouping Trademark Engine's supplied records by those ranges provides another perspective on filing activity.
| Classification | Recorded Entries | Share |
|---|---|---|
| Goods classes | 47,982 | 52.02% |
| Services classes | 42,099 | 45.64% |
| Unclassified entries | 2,160 | 2.34% |
| Total | 92,241 | 100% |
Three Classes Account for 67.7% of Service-Class Entries
A closer look at the 42,099 recorded service-class entries reveals a significant concentration. Classes 41 (Education and Entertainment), 42 (Computer and Scientific Services), and 35 (Advertising and Business Services) account for a combined 28,480 entries, representing 67.7% of all service-class activity.
This shows that education, technology, and business services collectively make up more than two-thirds of Trademark Engine's identifiable historical service-class entries.
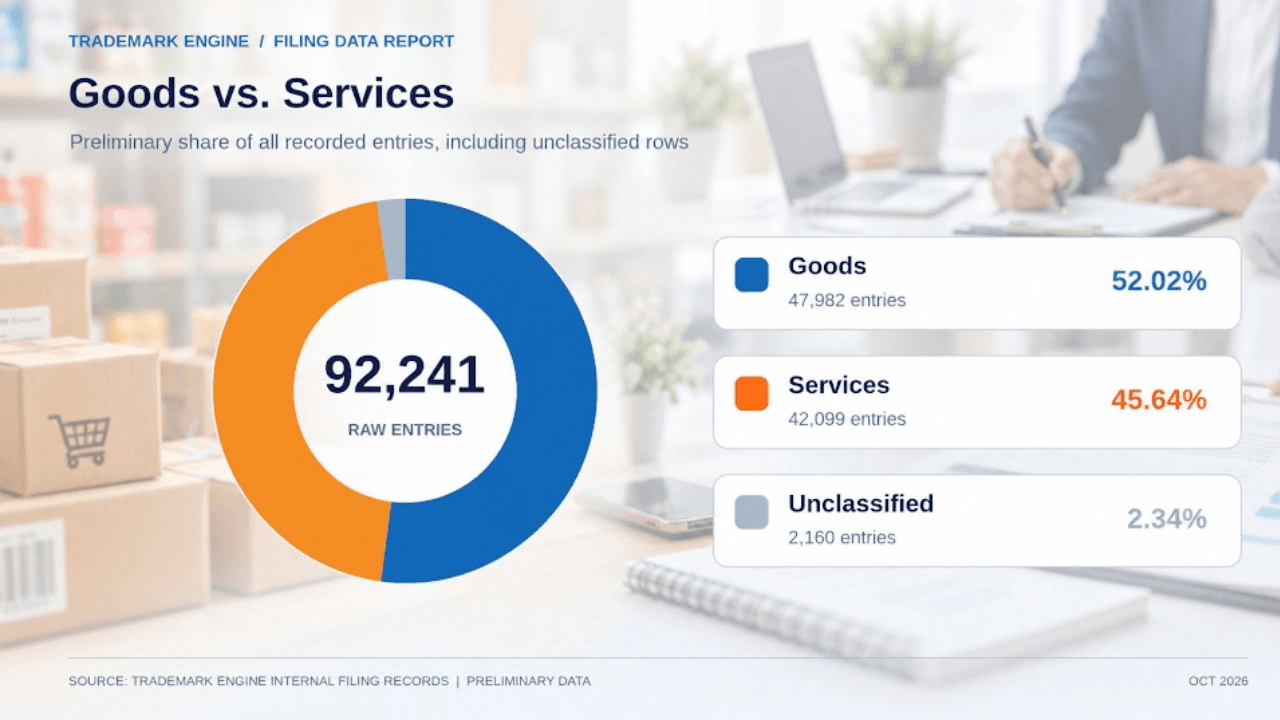
Goods account for 5,883 more entries than services.
The difference is meaningful but not overwhelming. Nearly half of the supplied records belong to service categories, including education, software services, financial services, healthcare, and construction.
This helps explain why Class 41 ranks so highly despite Class 25 leading overall.
The records reflect filing activity across both businesses selling physical products and businesses providing services.
Which Other Industries Have Notable Filing Counts?
Several categories outside the top five also contribute substantial volumes.
Consumer Products
| Category | Class | Recorded Entries |
|---|---|---|
| Paper Goods and Printed Materials | 16 | 4,031 |
| Cosmetics and Cleaning Products | 3 | 3,169 |
| Toys and Sporting Goods | 28 | 2,490 |
| Housewares and Glass Products | 21 | 2,085 |
| Staple Foods | 30 | 1,955 |
| Jewelry and Precious Metals | 14 | 1,069 |
Class 16 leads these categories, followed by cosmetics and cleaning products.
Beauty brands may find the Class 3 count especially relevant. However, certain medicated skincare products may belong in Class 5 rather than Class 3.
Trademark Engine's Class 3 vs. Class 5 guide for skincare brands explains the distinction.
Healthcare, Finance, and Construction
Class 44, covering medical, veterinary, and certain beauty-care services, has 2,524 entries.
Class 36, covering insurance, financial, and real estate services, follows with 2,472.
Class 37, covering construction, repair, and installation services, has 2,375.
Class 5, which covers pharmaceuticals and certain medical preparations, records 2,168.
Together, these four categories contribute 9,539 entries.
Their presence illustrates the range of professional and specialized industries represented in Trademark Engine's records.
What About the Least Common Trademark Classes?
Not every category attracts thousands of recorded entries.
Several specialized product classes appear far less frequently.
| Class | Category | Recorded Entries |
|---|---|---|
| 15 | Musical Instruments | 277 |
| 17 | Rubber Products | 156 |
| 13 | Firearms and Explosives | 156 |
| 22 | Ropes, Tents and Fiber Products | 122 |
| 27 | Floor Coverings | 112 |
| 2 | Paints | 104 |
| 23 | Yarns and Threads | 46 |
Class 23 has the lowest identifiable class count, with 46 entries.
By comparison, Class 25 has approximately 309 times as many.
This difference should not be confused with the level of trademark protection available.
A class with fewer recorded entries does not necessarily have fewer competitors, a higher approval rate, or a simpler registration process.
The numbers indicate how frequently each class appears in Trademark Engine's records—not its commercial importance or legal risk.
What Do These Filing Patterns Mean for Your Business?
If you're preparing to file a trademark application, these figures can help you understand which classes commonly appear in the records.
But your business should not select a class simply because it ranks highly.
Consider these examples:
| Business Type | Class Worth Investigating |
|---|---|
| Clothing or footwear brand | Class 25 |
| Online courses or training | Class 41 |
| SaaS platform | Class 42 |
| Downloadable mobile app | Class 9 |
| Retail store services | Class 35 |
| Non-medicated cosmetics | Class 3 |
| Restaurant services | Class 43 |
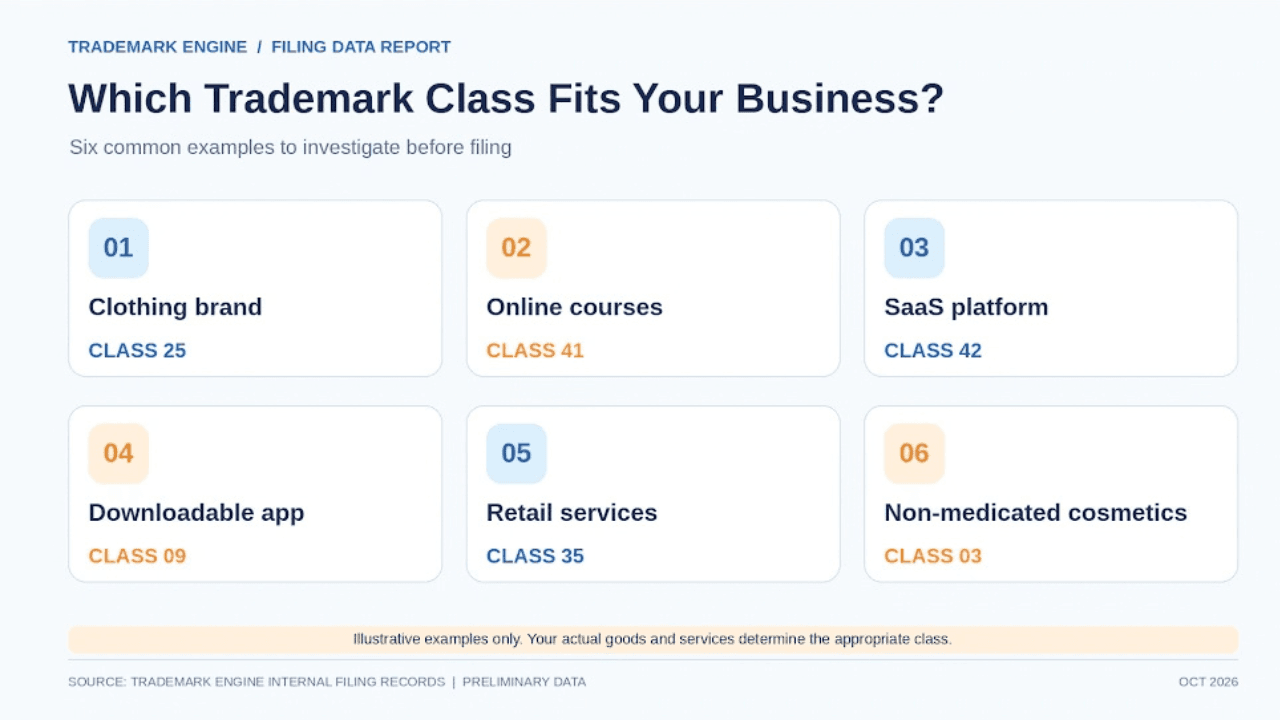
These examples are starting points, not automatic recommendations. The correct classification depends on the specific goods or services identified in the application.
Before filing, focus on three questions:
What exactly are you selling or providing? A product and a related service may belong to different classes.
Does your business offer more than one type of product or service? You may need to investigate multiple classes.
Could another business already be using a confusingly similar mark? A trademark search should consider related goods and services, including those in different classes.
The USPTO's trademark classification guidance provides official information on identifying goods and services.
Trademark Engine's trademark class guide offers additional examples.
The central lesson is simple: use the data to understand filing patterns, but base your application on your actual business activities.
About the Data: Source and Methodology
This report analyzes Trademark Engine's all-time internal filing records, representing approximately 10 years of company history. The dataset was provided by Trademark Engine's team and includes 92,241 recorded entries based on the database field COUNT(O.ID) and associated trademark class descriptions.
The figures reflect cumulative historical filing activity rather than filings from 2026 alone. Therefore, the analysis identifies the distribution of recorded filings across classes but does not measure annual growth.
Percentages are calculated using the overall dataset or the relevant goods- and services-class totals, as indicated in each section.
Three source-data details require review:
- One row containing 2,159 entries has no class description.
- Class 19 appears twice, with counts of 339 and 15.
- One additional record contains a free-text business description rather than a standardized class.
The reporting period, extraction date, and exact database definition of an entry were not supplied.
As a result, the figures describe recorded class-level activity. They are not presented as confirmed USPTO registrations, unique business counts, or national trademark filing totals.
Percentages may change slightly once the irregular records are reconciled.
Conclusion: What the Filing Data Tells Us
Trademark Engine's filing data reveals a concentrated distribution across clothing, education, technology, and business services.
Class 25 leads with 14,213 recorded entries, followed by Class 41 with 13,278. The top five classes account for more than half of the dataset, while smaller categories demonstrate the diversity of businesses represented.
For business owners, these findings offer useful context about where trademark filing activity appears most frequently. Still, popularity alone should never determine which class you choose.
Understanding your specific goods or services, reviewing relevant classifications, and searching for similar marks remain important steps toward building an informed filing strategy.
Explore Trademark Protection for Your Business
Whether your business operates in a high-volume category or a specialized industry, Trademark Engine's trademark search and registration services can help you explore your filing options and prepare for the next steps in protecting your brand.
Trademark Engine Editorial Team
Frequently Asked Questions
Class 25 (Clothing and Footwear) ranks first, with 14,213 recorded entries. It accounts for 15.41% of the supplied total.
Class 41 (Education and Entertainment) leads the service categories with 13,278 entries.
Classes 9 and 42 have a combined 13,375 entries. The relevant class depends on whether the offering involves downloadable software, online software services, or other technology-related activities.
Not necessarily. Filing volume alone cannot establish rejection rates. The USPTO evaluates applications against legal requirements, including possible conflicts with existing marks.
No. The figures come from Trademark Engine's supplied dataset and should not be treated as representative of all U.S. trademark filings.
Get Trademark Tips and Compliance Guidance
Subscribe for updates, insights, and resources that help you stay compliant and grow your mission.